This is the a Million Dollar question. Isn’t it? If you develop the mastery skill in stock selection, then definitely you will start ahead from others in the game. Here we will share an fast and efficient ways to find the desired stocks.As we all know, manual process always takes time and the chances of erroneous result is much higher than the well defined automated process. So, is there any way possible so that we can get the stock names in an excel sheet or in a text file without searching for all the stocks manually. After all, life is becoming very busy day by day and in the Drone era we always love the automated processes in our daily life. So why not in the case of winning stock screening.
Yes my friend, you can do this easily using the Python. If you do not know how to run Python, don’t worry. Just comment in below and we will help to set up the system.
What is the exact strategy?
There is not present the one single strategy, but a combination of strategies. To find the winning stock we have to analyse different parameters from different point of views. But here we will discuss one of the most important entry point.The first entry point according to lot of successful traders are to find the sectors which are performing very good in the desired time-frame. So we will check the monthly, weekly , quarterly and max half-yearly time frame. We are selecting the larger time frame because to validate if there is any noise present or not.
Strategy in simple steps:-
- identify the time frame of your swing trading. Let’s assume it’s maximum 1 month.
- Now check the 6 months index price-chart of various sectors listed. Here large date range is considered to eliminate the extra noises.
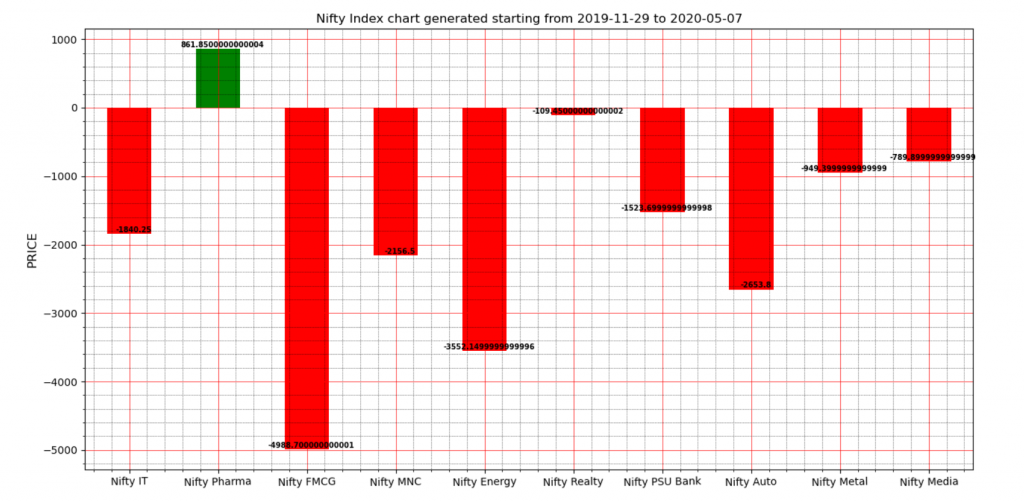
So from this above picture it’s clear that the Nifty-Pharma has been performed a pity well. But is it now performing well?
- It’s the third step, which many traders follows. Now check the performance of last 1 month.
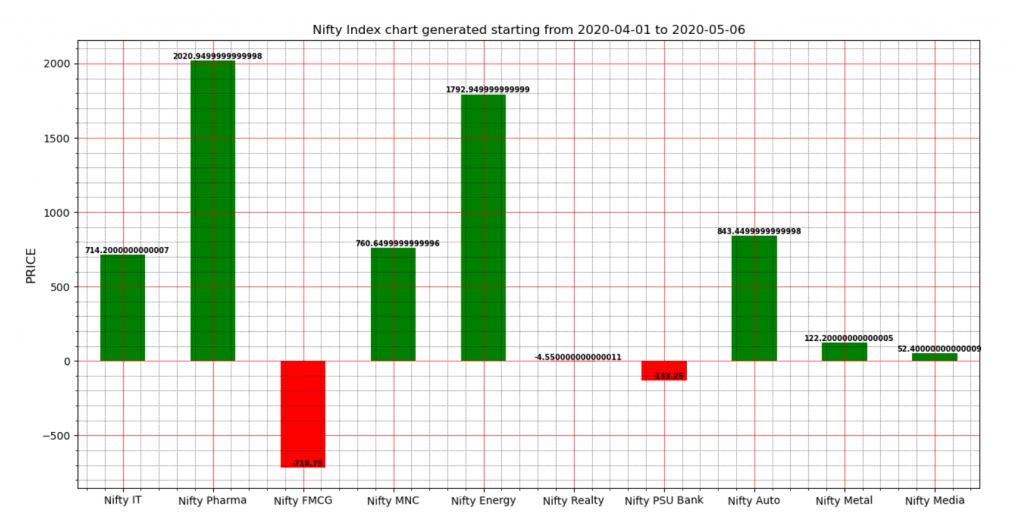
Yes it’s Nifty Pharma still performing well. Now let’s check the last 1 week data.
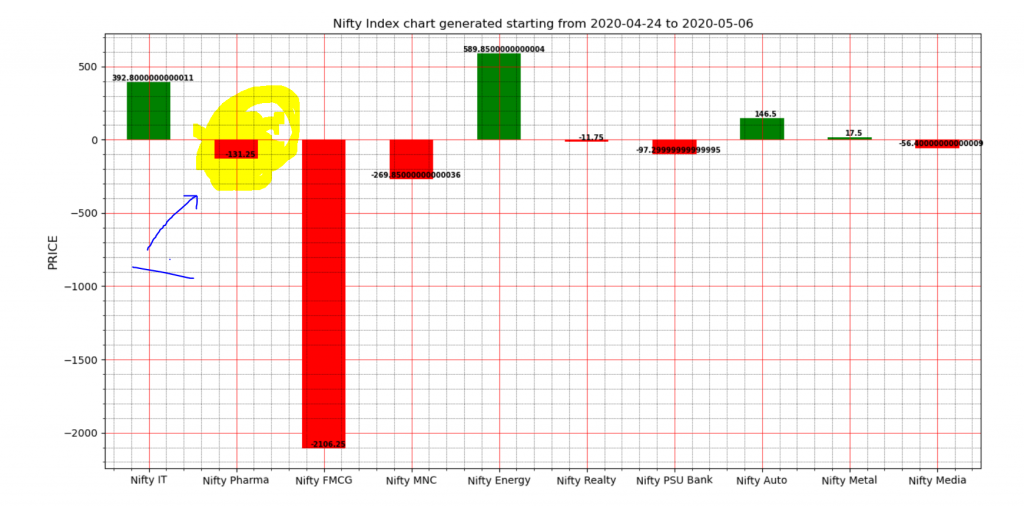
So, from this above chart, it’s clear that for the last one week the pharma is not performing well. Then what to do? That decision can only be taken after checking different parameters of technical analysis data. So yes, for time being it’s not good to enter the pharma. Just try to understand the sentiment of the market. n this way you can select the sectors and also the individual stock that will give you a higher return in a very short time.
N.B. All the above charts are generated using python matplotlib library. For source code please visit https://github.com/ARITR8/Python-Data-Analysis-Stock-Data-NSE